
Size Your Audience Like You Mean It
Growing an audience from scratch is one of the most exciting and challenging things a publisher can do. And one of the first things we figured out building The 19th was that the hardest questions isn't actually 'what should we cover?' It's 'who, exactly, are we for?’
Without clarity around that, everything downstream — growth targets, funder conversations, product decisions — gets harder.
Many publishers do have an answer to the "who is your audience" question — it just tends to be a traffic number. Monthly uniques. Email subscribers. Social followers. Those metrics tell you how many showed up, not whether the people showing up are the ones you're actually trying to reach. The gap between those two things is where a lot of growth strategies quietly break down.
The publishers I work with who have the most clarity are the ones who stopped chasing reach and started defining it: a specific audience, in a specific place, that they can measure and grow toward over time.
That discipline does two things at once. It grounds your growth story in something real — not viral spikes, but sustained progress toward a defined community. And it gives funders, sponsors and donors a denominator: a number that lets them evaluate how effectively you're reaching the people you say you serve.
This post gives you a framework for building that denominator — and a concrete example of how the math works.
Using TAM to size your audience
TAM stands for Total Addressable Market. In its original form it doesn't translate well to mission-driven publishing — you're not trying to capture a market, you're trying to serve a community.
Adapted for publishers, it becomes a defensible estimate of how many people exist in the world you say you serve, grounded in data you can source and assumptions you can defend.
The base formula is simple:
One primary segment × one primary geography × one measurable proxy = a TAM you can stand behind
A perfect number isn't the point. The discipline of arriving at it is.
The piece most publishers skip: the proxy
When what you care about isn't directly measurable — "people invested in civic life," "Spanish-speaking families who want local accountability journalism" — you need a proxy: a measurable indicator that's directionally aligned with your mission.
Good proxies for community-first publishers might look like:
Voter turnout rates (for civic/accountability journalism)
Bilingual household data from the U.S. Census (for language-specific outlets)
Broadband access rates (for digital-first outlets in underserved geographies)
School enrollment or poverty rate data (for outlets focused on education or economic mobility)
The proxy is what turns "we serve engaged residents" into a number — and a number into a growth target.
Mapping TAM to your audience funnel
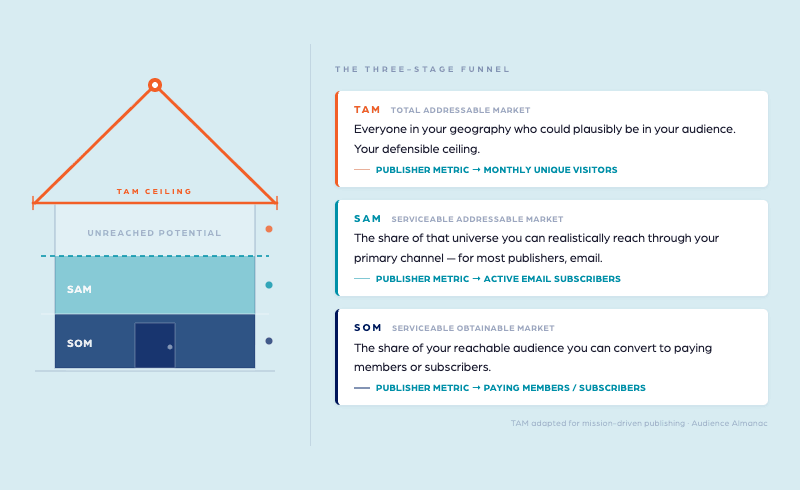
The framework doesn't stop at TAM. Think of it as three nested estimates — each one bringing you closer to a realistic audience target:
TAM (Total Addressable) is the universe: everyone in your geography who could plausibly be in your audience. Your defensible ceiling. In the calculator, this maps to monthly unique visitors — the broadest measure of who's in the world you serve.
SAM (Serviceable Addressable) is your relationship market: the share of that universe you can realistically reach through your primary channel. For most digital publishers, that's email — and SAM maps directly to your active subscriber pool.
SOM (Serviceable Obtainable) is your revenue market: the share of your reachable audience you can convert to paying members or subscribers, based on realistic benchmarks for outlets like yours.
The house graphic says it well: know the ceiling, then build toward it. TAM is the roofline. Your near-term target is somewhere in the middle. The gap between them is unreached potential — and a growth story waiting to be told.
What the math actually looks like
To understand how TAM math can work for a community-first publisher, consider the fictional outlet, Raíz Austin. Here's the scenario:
Outlet: Raíz Austin, a nonprofit 501(c)3 producing solutions-focused civic journalism for young Austinites. Est. March 2024.
Mission: Covering housing costs, student debt, climate and democratic participation — "Legacy outlets cover city hall; we cover the block."
Primary audience: Civically engaged Austin residents ages 18–40, especially Gen Z and younger Millennials navigating housing insecurity, first-time voting and a city that's changed faster than its institutions.
The market stack:
Starting from a base population of 1.97M across Travis, Williamson and Hays Counties (U.S. Census, 2023 ACS), Raíz Austin applies three successive filters:
Eligibility: 21% of adults actively follow local news (Pew Local News Fact Sheet, 2025) — narrowing the pool to roughly 414K
Behavioral: 63% voter turnout rate (U.S. Elections Project / Univ. of Florida) applied as a civic engagement proxy (our measurable stand-in for civic interest) → TAM: 99K
Reachability: 32% of that group uses email newsletters as a news source (Pew, Feb 2026) → SAM: 31.7K — the audience Raíz Austin can realistically reach
Conversion: At a 15% nonprofit news benchmark → SOM: 4.8K paying members/subscribers
A demographic sub-filter (38% ages 18–40, Census) layers on top to confirm the primary segment is well-represented in the TAM — it's a check, not a cut.
What the actual numbers say:
Here’s how Raíz Austin's hypothetical audience metrics stack up against its TAM:
| Stage | Estimated | Actual | Signal |
|---|---|---|---|
| TAM (monthly uniques vs. estimate) | 99K | 38K | Growing |
| Monthly uniques vs. SAM | 31.7K | 38K | Out-of-market traffic |
| Email subscribers vs. SAM | 31.7K | 4.2K | Healthy |
| Paying members vs. SOM | 4.8K | 180 | Early stage — conversion focus |
A few things worth noting in the data:
What if uniques exceed the SAM? At 38K visitors against a SAM of 31.7K, Raíz Austin is likely reaching people outside its core reachable segment — perhaps some combination of secondary audiences (educators, advocacy orgs, national journalists) and organic discovery. That's not a problem; it's a targeting question. The SAM is the audience worth converting. The overflow is context.
Email conversion is healthy. At 11.05% of uniques converting to email subscribers, Raíz Austin is above the 3–8% nonprofit news benchmark. The top of the funnel is working.
Member conversion is the growth story. 180 paying members out of a SOM of 4.8K means Raíz Austin is at 3.8% of its realistic paying audience — early stage, with significant room to grow. The mid-funnel conversion rate (email → members at 4.29%) trails the 5–12% benchmark for nonprofit news, which points to where the work is: moving engaged readers toward a financial commitment.
That's what TAM gives you — not just a ceiling, but a map of where you are in relation to it.
Two patterns from the field
Earlier this year, I ran a TAM coaching sprint with 10 publishers through Tiny News Collective. Publishers used the same framework, with very different starting points. Before getting to the cases, one thing I told every publisher at the start: you do not need perfect data. You need credible logic.
Think of it like building a house. You don’t need architect-grade blueprints before you can describe the structure — a good sketch with sound reasoning gets you further than a perfect model that never gets finished. Start with what you have: Census data, Pew research, your own surveys, editorial judgment. Build from there.
Once publishers got into the data, two issues were common.
Too small. A local digital outlet in a news desert had applied such restrictive demographic filters that their TAM came out unrealistically small — undermining both their confidence and their pitch.
The instinct was understandable: they wanted to be precise. But precision without proportion isn’t credible, it’s limiting. We rebuilt it using voter turnout as the proxy: population × turnout rate × newsletter consumption assumptions. The result: a realistic near-term subscriber target and a funder-ready story about civic participation.
Too broad. A high-performing outlet with strong conversion metrics had the opposite problem: their TAM was “all adults in the metro area.” The number was technically defensible but strategically inert — it didn’t say anything about who the outlet was actually for.
The TAM insight was directional: reframing to “civically engaged residents” and grounding that definition with a measurable proxy tends to produce a smaller, more meaningful number — and a significantly stronger pitch because it better matched what they were actually building.
In both cases, the data wasn’t the problem. The framing was.
The blocker is usually the deciding, not the math
Another issue that the TAM exercise helps surface: vague or conflicting audience definitions. Publishers who moved through the TAM work fastest were willing to pick, even imperfectly, and iterate from there. "We serve everyone in our community" feels inclusive. It also makes it hard to tell a coherent growth story, align product decisions, or give a funder a number they can evaluate.
Choosing a primary segment doesn't mean excluding everyone else. It means being clear about who you're optimizing for.
Run this before your next funder conversation
You don't need the full worksheet to start:
Write one sentence: We primarily serve [segment] in [geography].
Find one public data source that approximates that group — Census, voter rolls, Pew research, an academic study.
Apply a realistic consumption assumption. (Pew's local news data is a useful benchmark for digital outlets.)
That's your TAM v1. Rough is fine. Defensible is the goal.
From there, your near-term target becomes a share of that number — a claim you can explain and update as you learn more.
Use the TAM calculator
The worksheet behind the El Raiz example is the same tool I use in 1:1 coaching sessions with community-first publishers. You can access it at the link below — submit your name and email for access to a 5-step worksheet.
It walks you through segment, geography, proxy and funnel assumptions — and generates a TAM you can evaluate against actual audience stats.